![]()
Latest Desktop-Certified-Associate Actual Free Exam Questions Updated 110 Questions
Free Desktop-Certified-Associate Exam Braindumps certification guide Q&A
NEW QUESTION 11
Why we convert a numeric measure to a dimension?
- A. To show the labels in your view
- B. To disaggregate the field
- C. To aggregate the field
- D. To use this field in LOD
Answer: B
Explanation:
Measures are by default aggregated. We can change measures to dimensions if we want disaggregate that field.
NEW QUESTION 12
Extract can't be created in which of the scenario?
- A. When you perform cross-database joins
- B. When you perform the traditional join
- C. When you perform the blend
- D. When you perform the union
Answer: C
Explanation:
A blend is worksheet-specific, so you cannot create the extract while creating a blend.
NEW QUESTION 13
Select the correct options that allow you to ensure that your Phone layout automatically reflects changes to the Default dashboard?
- A. Click the open lock icon on right of your phone layout option
- B. All of the above
- C. Click the 3 dots on right of your phone layout option and select Auto-Generate Layout
- D. Click the 3 dots on right of your phone layout option and select Optimize Layout
Answer: A,C
Explanation:
Explanation
Refer:https://help.tableau.com/current/pro/desktop/en-us/dashboards_dsd_create.htm Go to the section- Phone layouts and the Default dashboard
NEW QUESTION 14
In Forecast, what is the shaded region?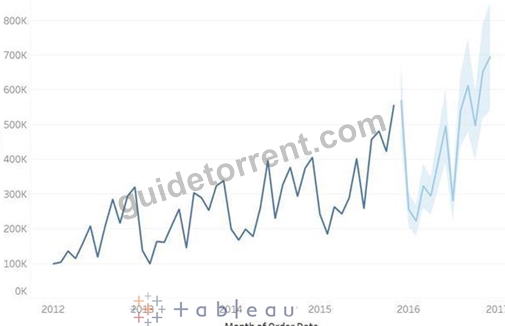
- A. none of these
- B. prediction interval
- C. exponential smoothing
- D. forecast model
Answer: B
Explanation:
Explanation
Refer:https://help.tableau.com/current/pro/desktop/en-us/forecast_create.htm
NEW QUESTION 15
Connect to the "Global Superstore" data source and find out which region was having the highest percentage of returned orders in 2013?
- A. Western US
- B. North Africa
- C. Eastern Asia
- D. Southern Africa
Answer: D
Explanation:
Explanation
Create a left outer join, so that we can calculate the percentage of the returned orders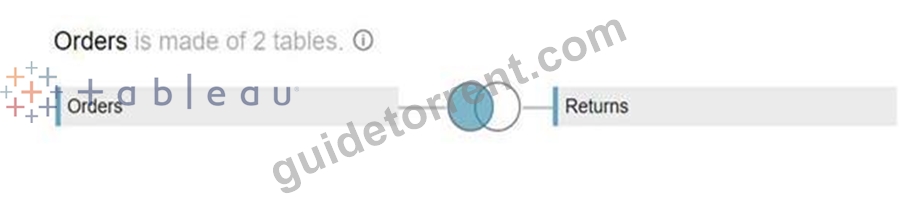
Create a calculated field "% of returned orders":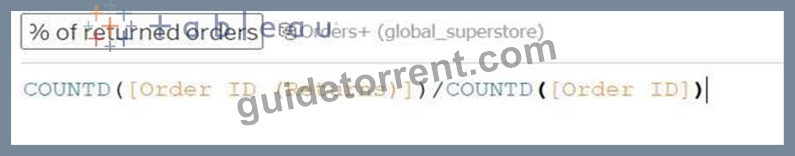
Drop the Order Date to the filters shelf and select the year 2013
Drop the Region to the rows and % of returned orders to the Text: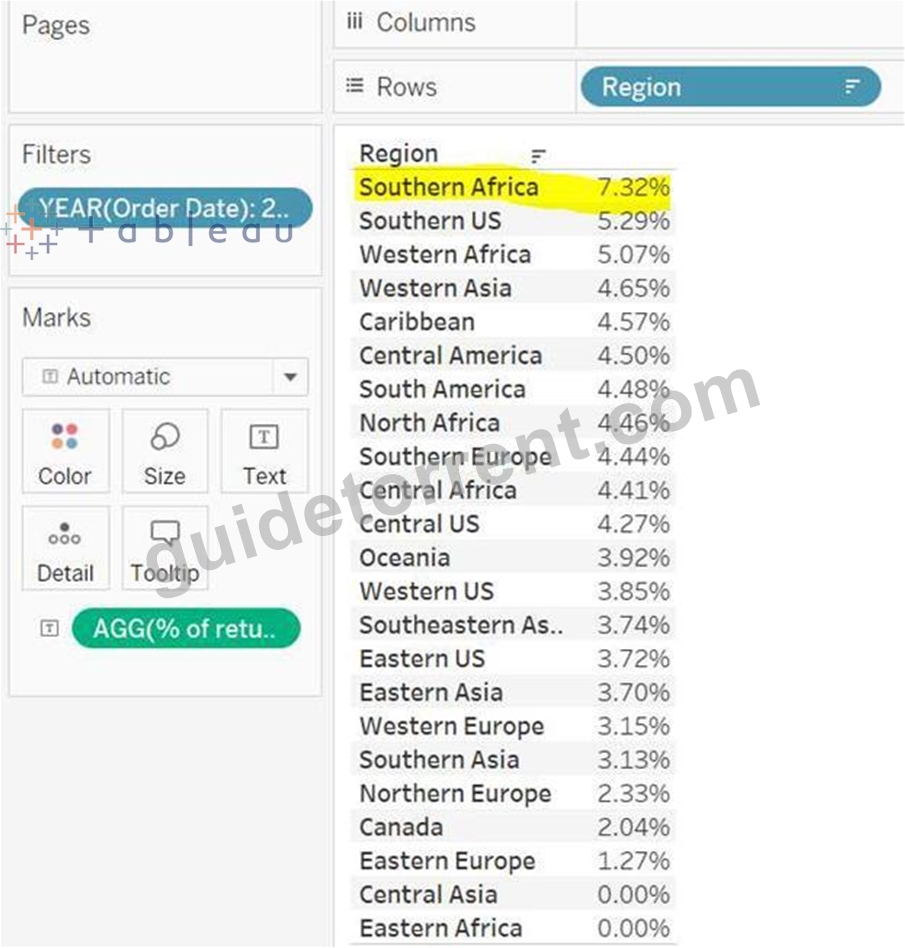
NEW QUESTION 16
Connect to the "Covid data" source. Create a line chart using continuous months and new deaths. Find the Excess Kurtosis for the sum of new deaths.
- A. -0.56
- B. -0.67
- C. -0.58
- D. -0.69
Answer: B
Explanation:
Drop the Date to the columns and select the continuous month. Drop New Deaths to rows.
Click on the Show/Hide card and enable the Summary Card.
Chart, line chart Description automatically generated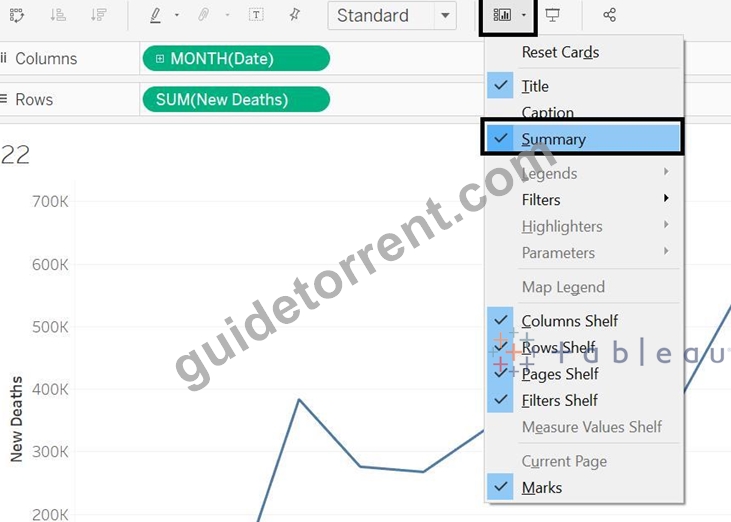
You will see the Summary Card on the right, if Excess Kurtosis is not enabled, click on the drop-down and select the Excess Kurtosis.
Graphical user interface, application Description automatically generated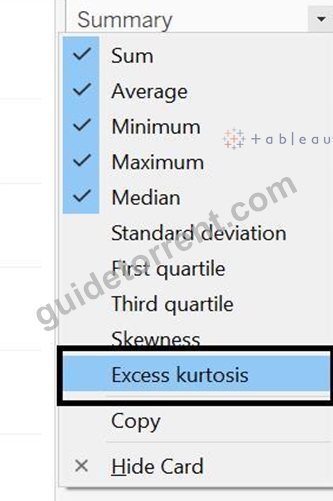
NEW QUESTION 17
Connect to the "Significant Volcano Eruption" data source. What is the interquartile range of the distribution of Total Injuries data of the 21st century (show null values at default location)?
- A. 0
- B. 1
- C. 2
- D. 3
Answer: C
Explanation:
Drop year to filter shelf and select from 2000.
Graphical user interface Description automatically generated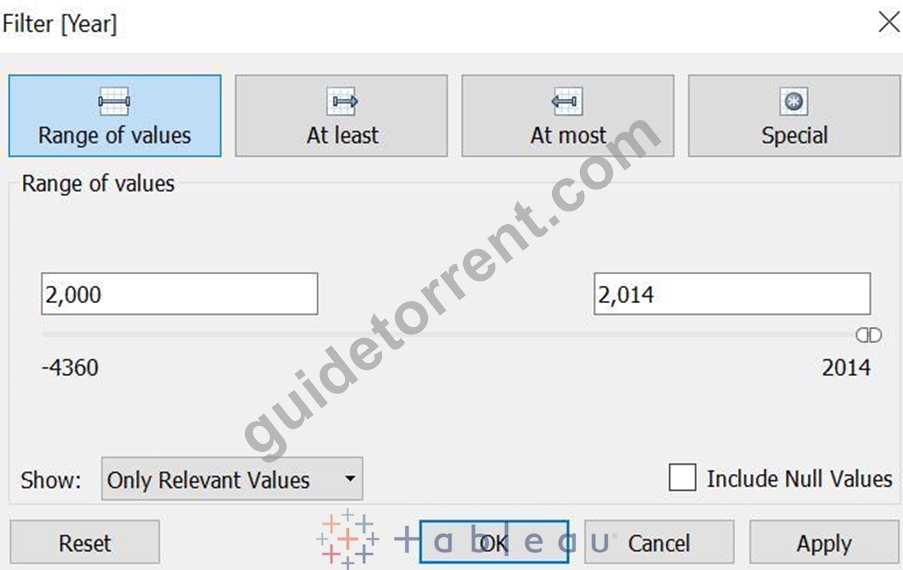
Drop Total injuries field to rows, go to Analysis -> Aggregated Measures (Untick this, it will disaggregate the total injuries field.
Click on Show Me, and select Box and whisker Plot.
IQR = Upper hinge - Lower hinge
Graphical user interface Description automatically generated with low confidence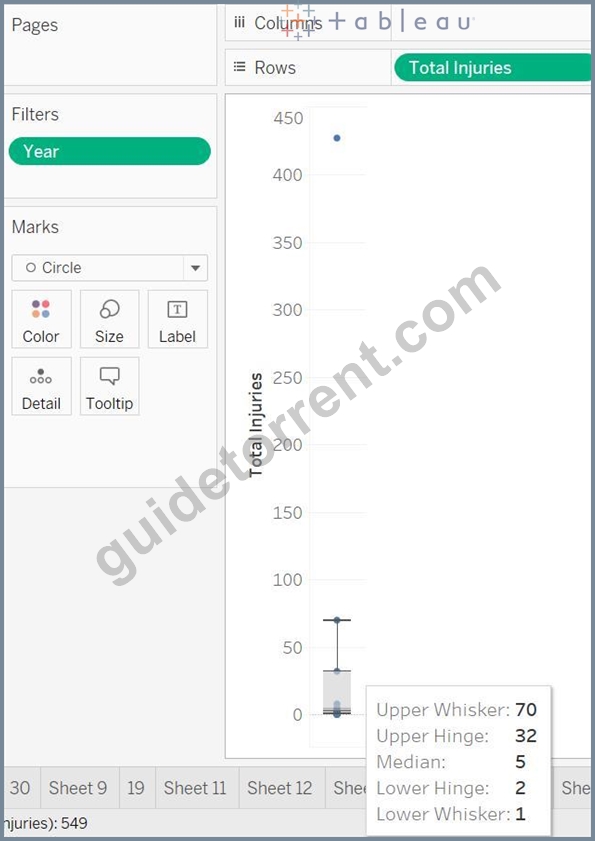
Here IQR = 32 -2 = 30
Topic 1, Exam Pool B
Download the Dataset from here:
https://drive.google.com/file/d/1z7LPBQNPWHChteShl0QL3yu_JcvstLGl/view?usp=sharing
Use the above data set to answers the questions under Exam Pool B.
NEW QUESTION 18
Connect to the "Significant Volcano Eruption" data source. What percentage of total deaths caused by volcanoes which were having a volcano index greater than 2 and elevation greater than 5000?
- A. 3.45%
- B. 6.58%
- C. 0.27%
- D. 5.61%
Answer: B
Explanation:
Create a calculated field as:
Graphical user interface, text, application Description automatically generated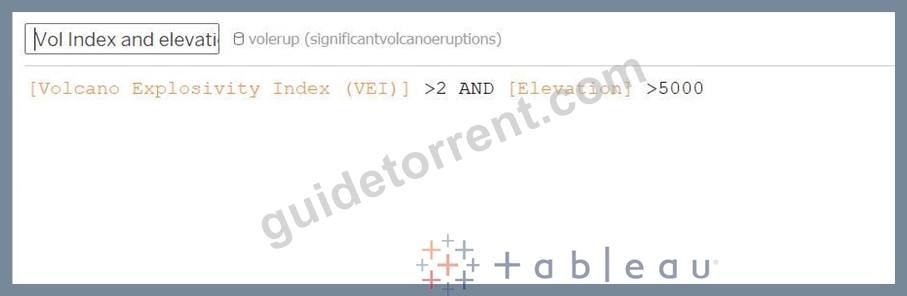
Drop this field to Rows and Total Death to the Columns. And Select the Quick Table Calculation-> Percent of Total.
Graphical user interface, application Description automatically generated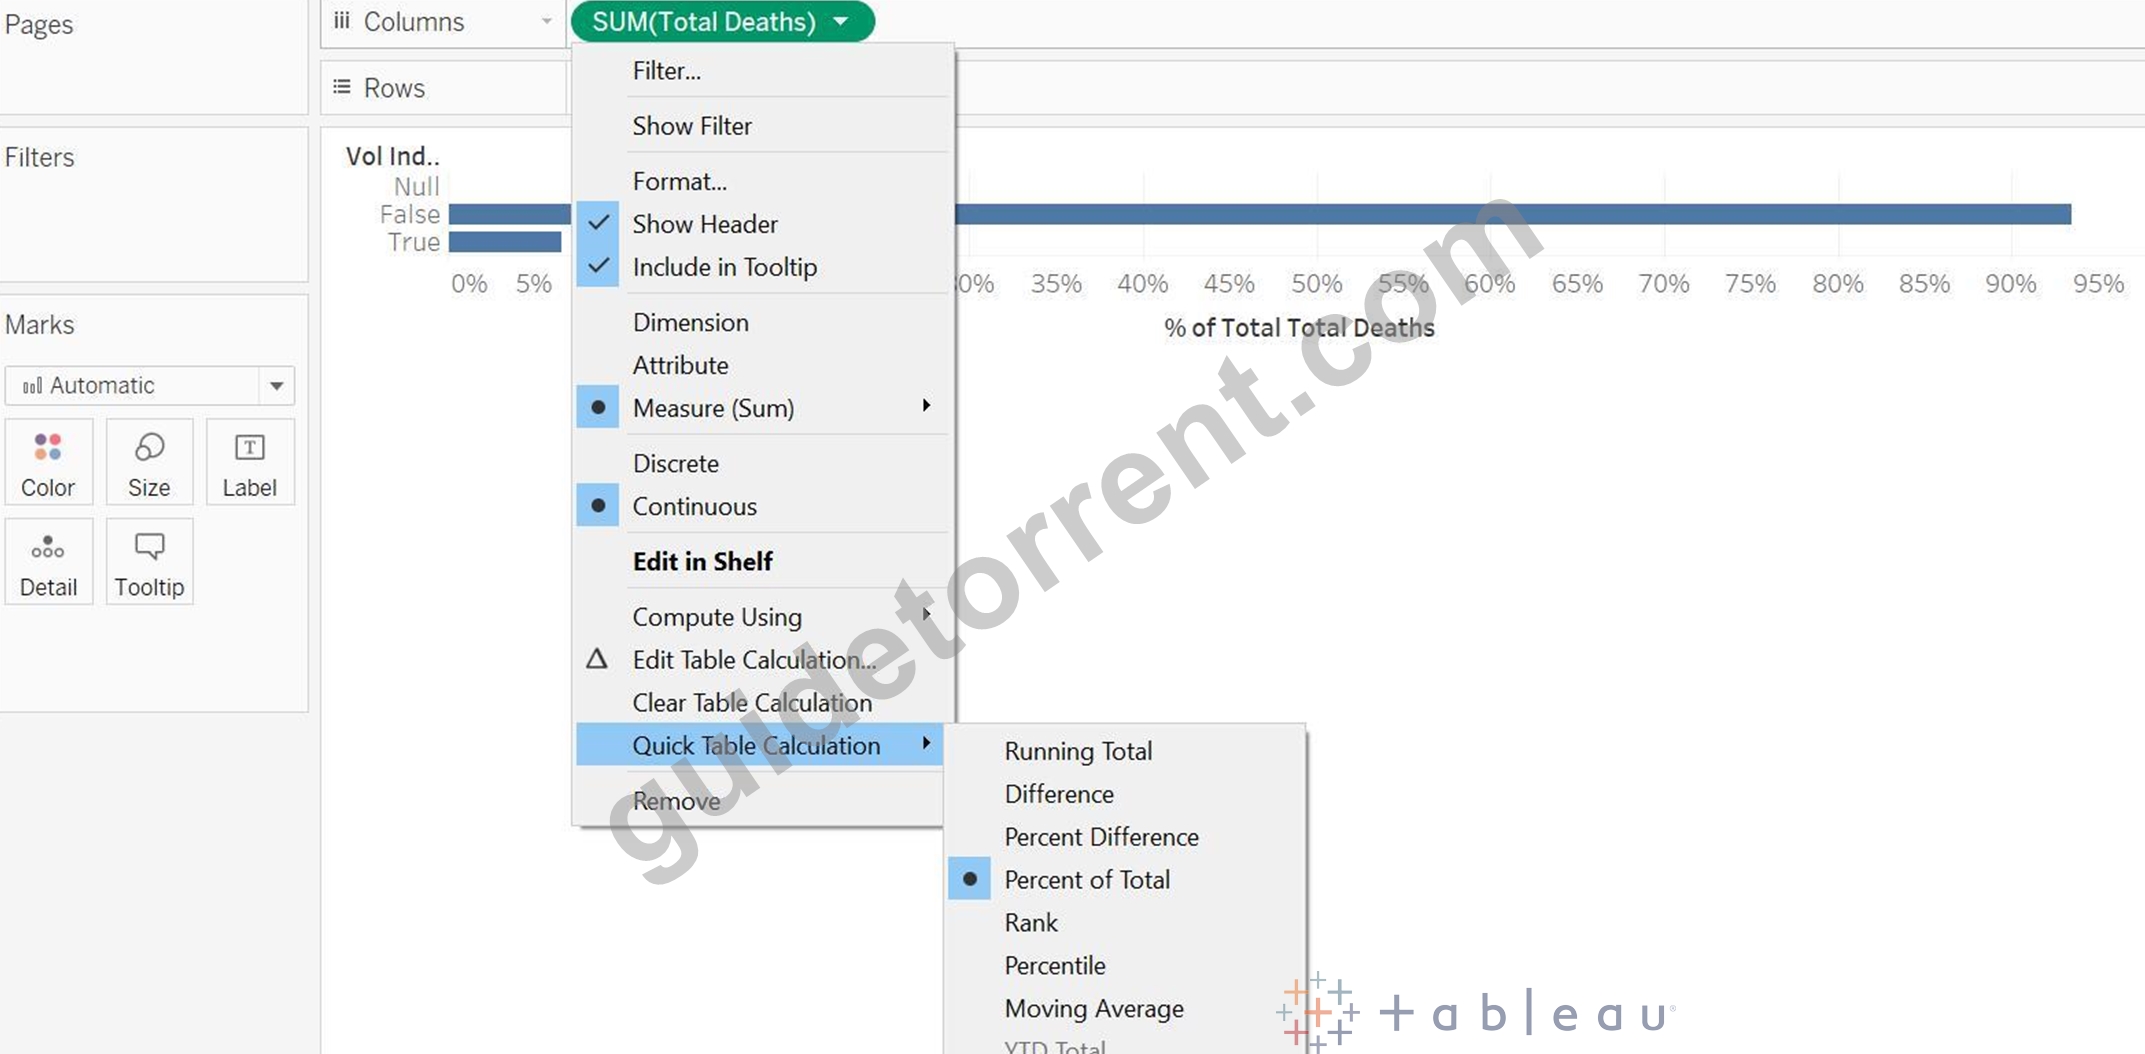
Graphical user interface, application, table, Word Description automatically generated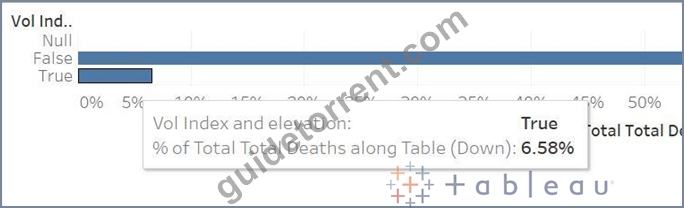
NEW QUESTION 19
Connect to the "Global Superstore" data source and use the Orders table. Find out how many products from the Office Supplies category are in the Top 10 most profitable product list?
- A. 0
- B. 1
- C. 2
- D. 3
Answer: C
Explanation:
Explanation
First, create a set using the Product Name. Select the Top condition as:
Drop this Set to the filters shelf and select IN only.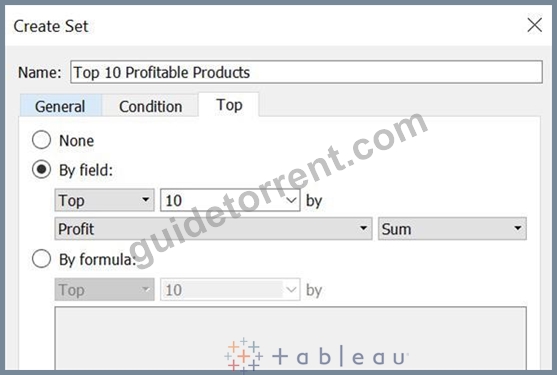
Drop this Set to the filters shelf and select IN only.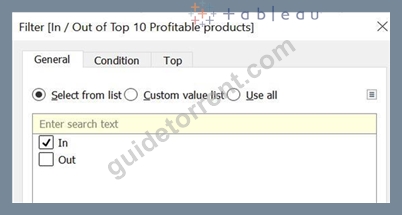
Drop the Category, Top 10 profitable products and Product Name to the view: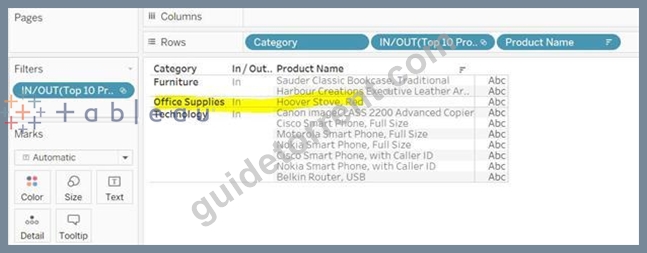
NEW QUESTION 20
In table calculations, partitioning fields define the direction of the calculation.
- A. FALSE
- B. TRUE
Answer: A
Explanation:
Explanation
When you add a table calculation, you must use all dimensions in the level of detail either for partitioning (scoping) or for addressing (direction).
Refer:https://help.tableau.com/current/pro/desktop/enus/
calculations_tablecalculations.htm
NEW QUESTION 21
Connect to the Olympic Athletes data source, find out how many countries participated in 5 different sports from 2000 to 2012?
- A. 0
- B. 1
- C. 2
- D. 3
Answer: A
Explanation:
First, find the distinct sports for each country:
Graphical user interface Description automatically generated with medium confidence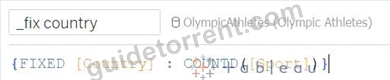
It will be created as a Measure, move this to Dimension
Get the distinct countries:
Graphical user interface Description automatically generated with medium confidence
drop these columns to the view, final view will look like this:
The X-axis represents a number of distinct sports. As the data set contains data from 2000 to 2012, so even if you don't include the filter, your answer would remain the same.
Chart Description automatically generated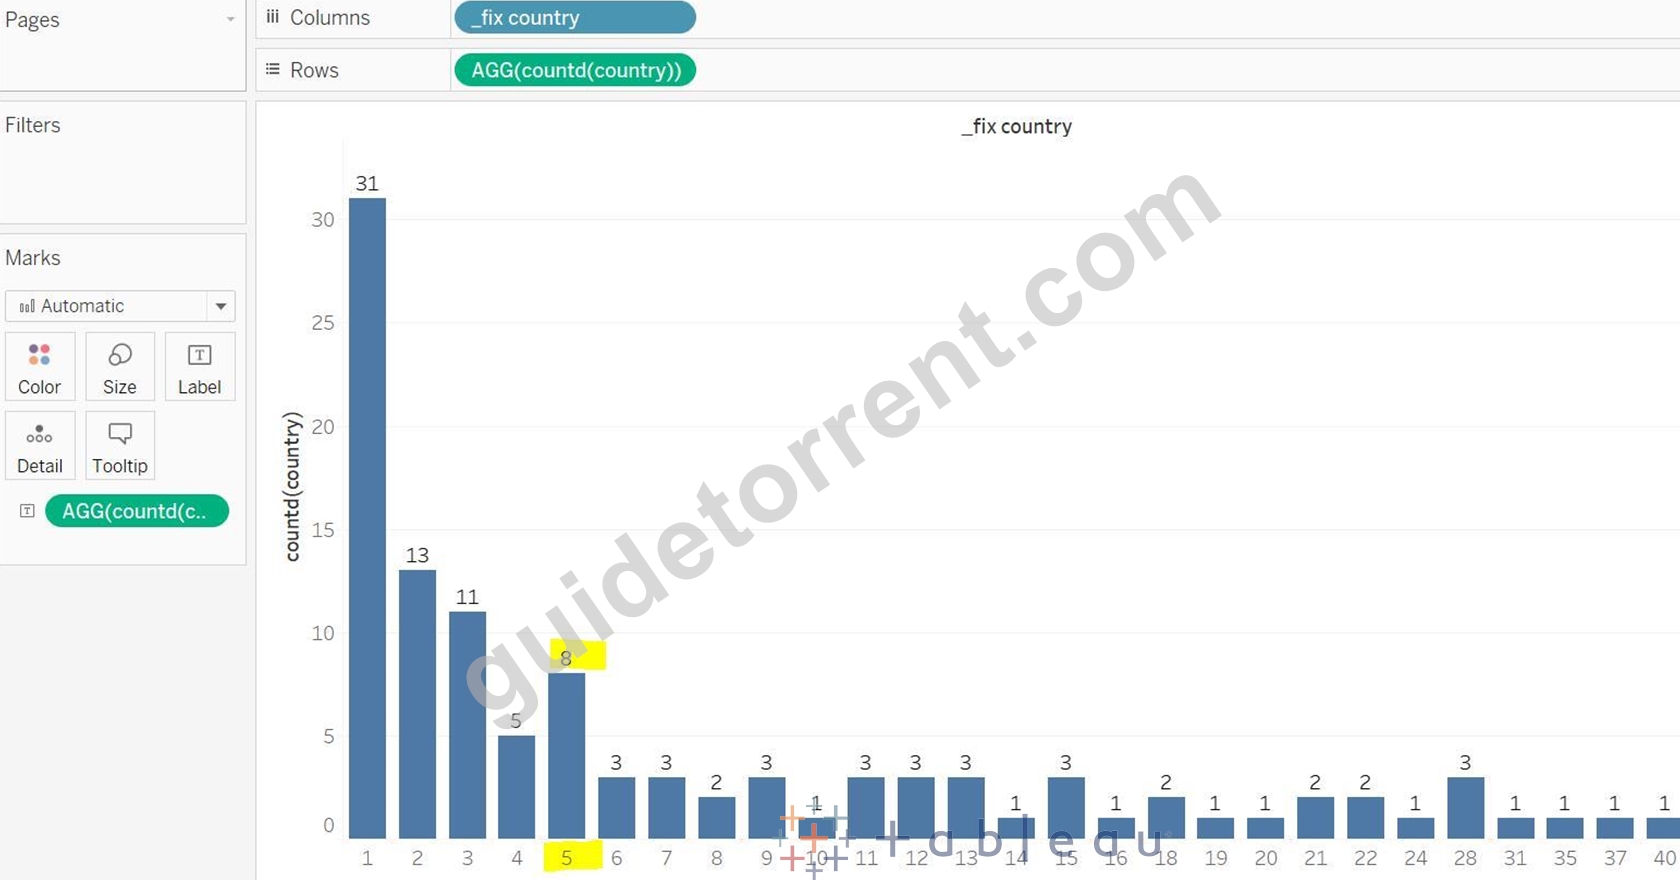
NEW QUESTION 22
How to add reference lines in a view? (Select correct two answers)
- A. Right Click on Axis and Add Reference Line
- B. Using Analysis Menu
- C. Using Data Pane
- D. Using Analytics pane
Answer: A,D
Explanation:
Using Analytics pane:
Graphical user interface, application Description automatically generated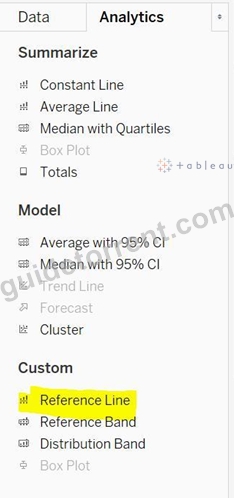
Right Click on Axis and Add Reference Line:
Graphical user interface, application Description automatically generated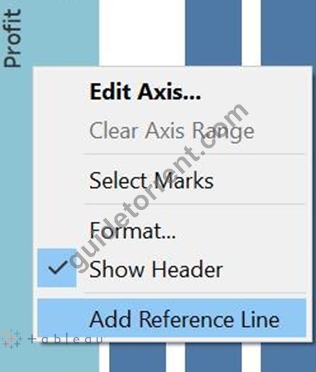
NEW QUESTION 23
What are the types of annotations available in Tableau?
- A. Area
- B. Circle
- C. Mark
- D. Point
Answer: A,C,D
Explanation:
Graphical user interface, application, table Description automatically generated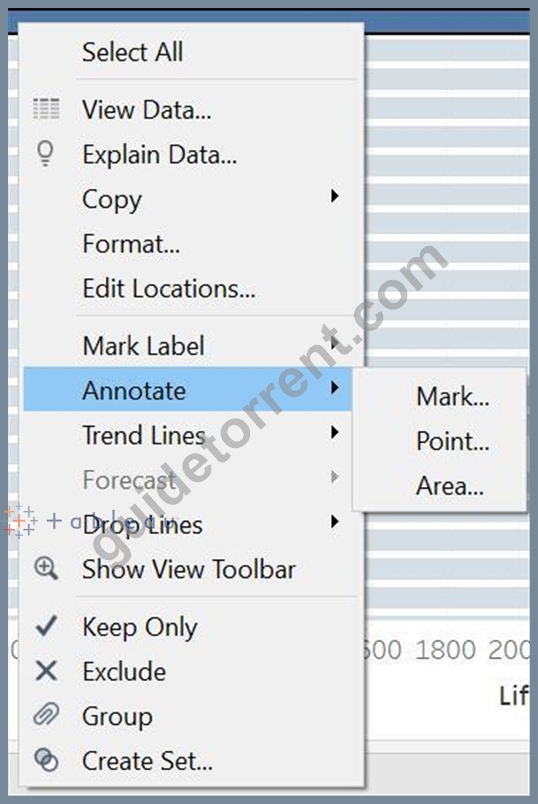
NEW QUESTION 24
Using the Profit Analysis Dashboard twbx file, find out the 5th most profitable product in the state of New York? You can add the functionality to the dashboard.
- A. Canon imageCLASS 2200 Advanced Copier
- B. GBC DocuBind TL300 Electric Binding System
- C. HP Designjet T520 Inkjet Large Format Printer - 24" Color
- D. Fellowes PB500 Electric Punch Plastic Comb Binding Machine with Manual Bind
Answer: B
Explanation:
Select New York State, you are getting only 3 products, and not 5.
Timeline Description automatically generated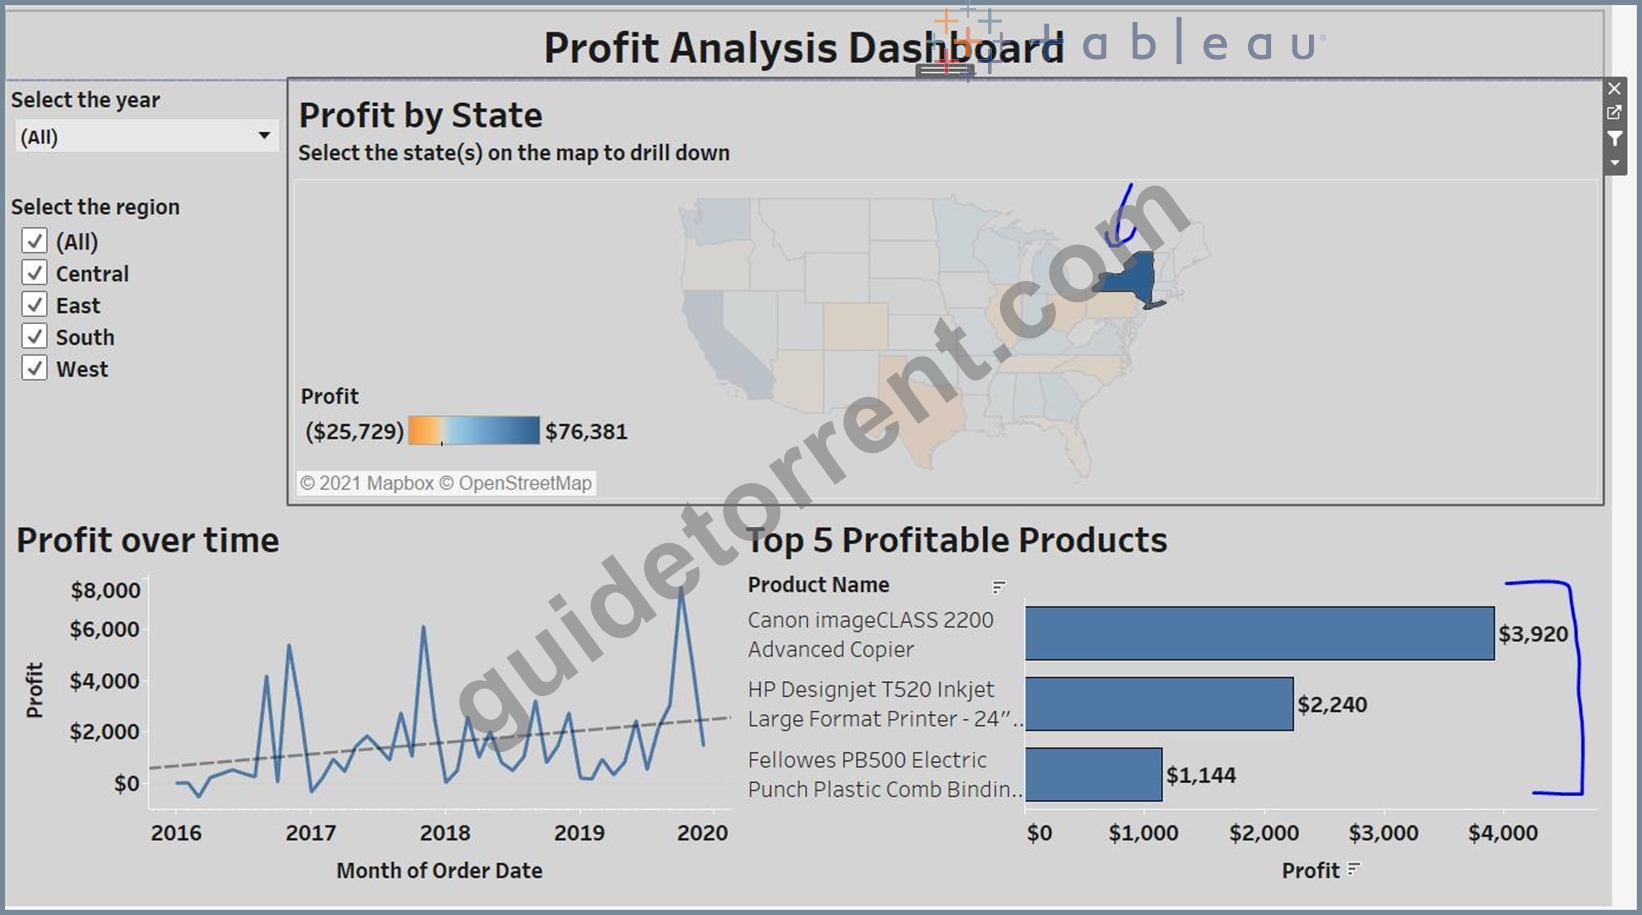
You need to add State as a Context filter in the Top 5 profitable products View. For that, go to the Top 5 profitable products sheet. (click on small arrow) Chart, bar chart Description automatically generated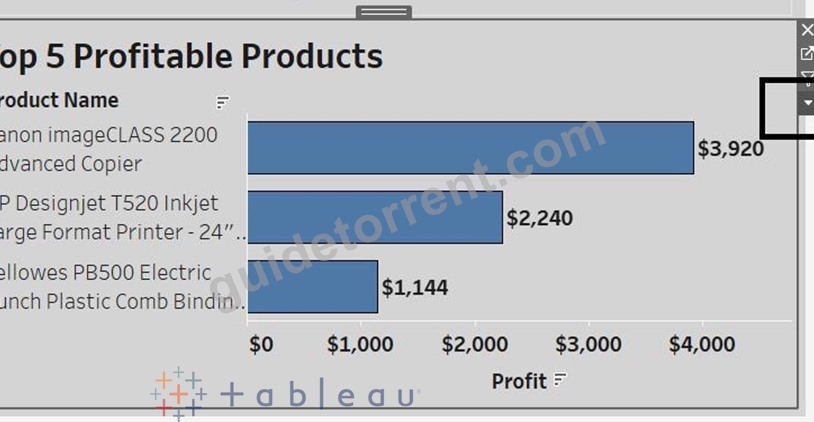
Select Add to Context on the State filter
Graphical user interface, text, application, chat or text message Description automatically generated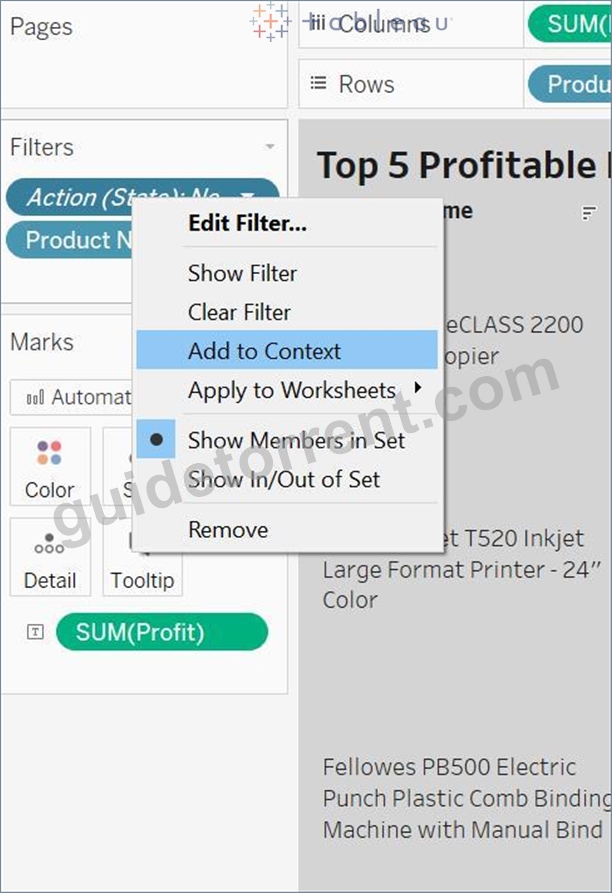
A picture containing graphical user interface Description automatically generated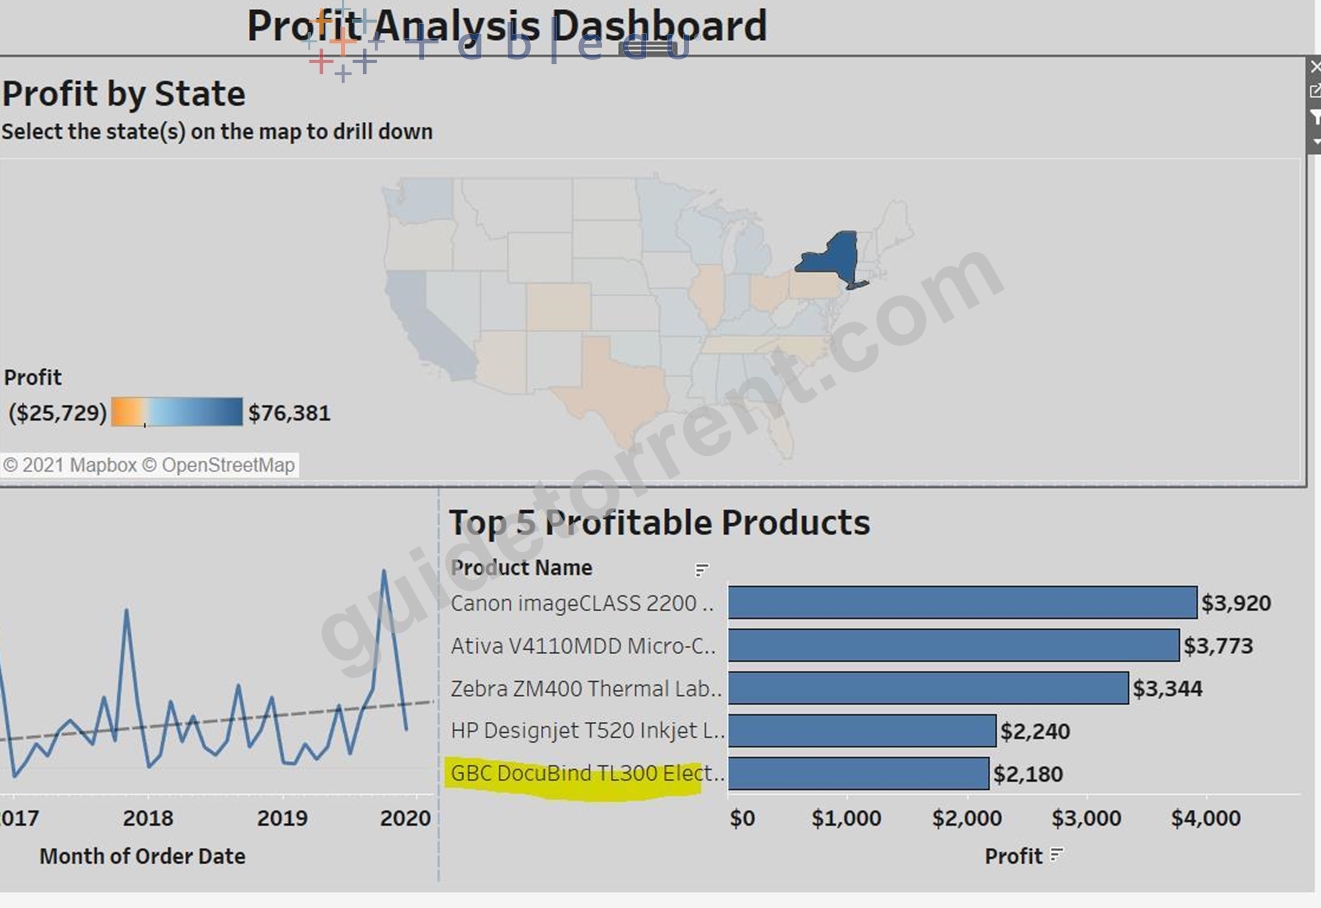
NEW QUESTION 25
Connect to the "Global Superstore" data source and use the Orders table. Create a bar in bar chart and compare the profit against the target profit for Canada Region. Consider target profit is 30% of the sales. Which of the following sub-categories has met or exceed the target profit?
- A. Labels
- B. Tables
- C. Paper
- D. Copiers
Answer: A,B,D
Explanation:
Graphical user interface, application Description automatically generated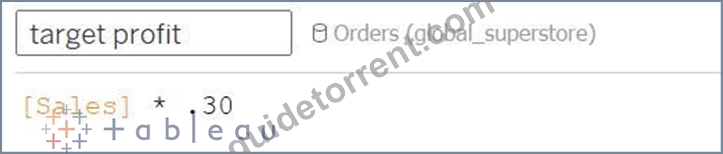
Drop Region at the filter and Select Canada
Drop Profit to columns and Sub-Category to Rows
Then drop the target profit to profit axis, it will create the combined axis chart.
Chart, bar chart Description automatically generated with medium confidence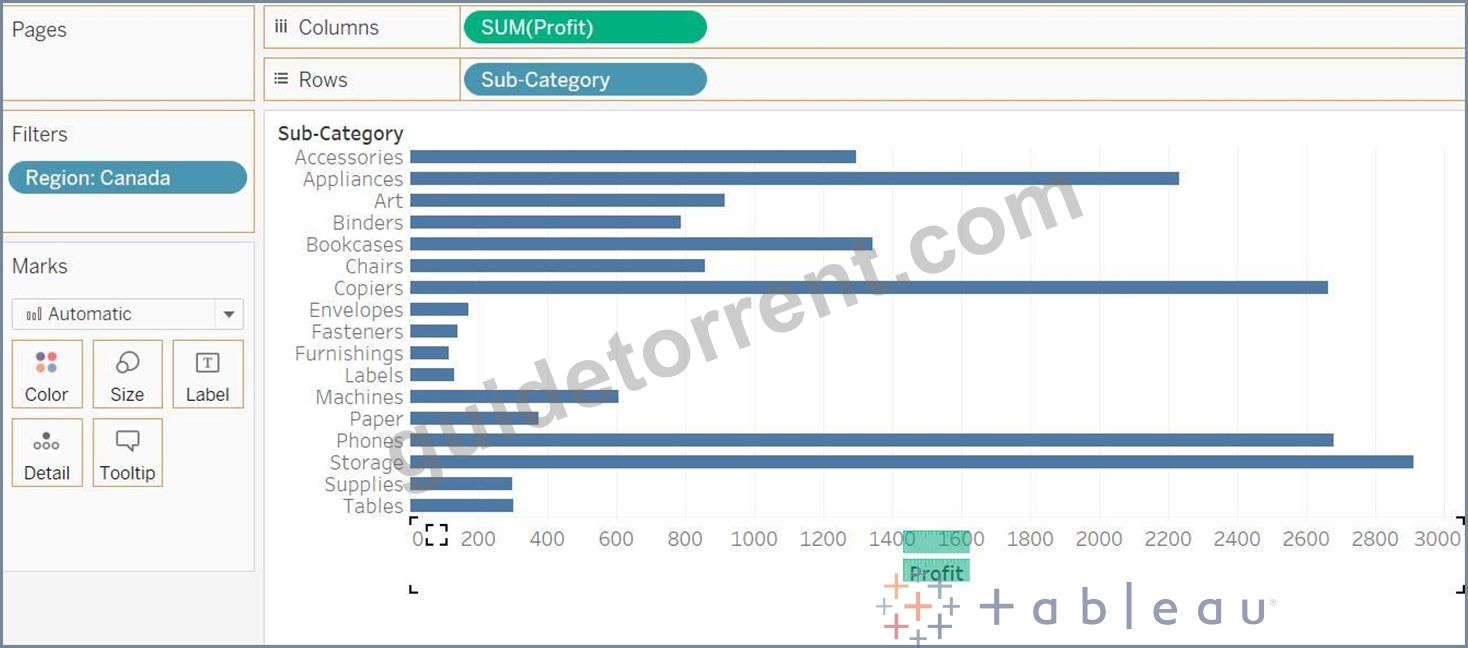
Now drop the Measure Names field from the Rows to the Color Marks Card.
Chart, bar chart Description automatically generated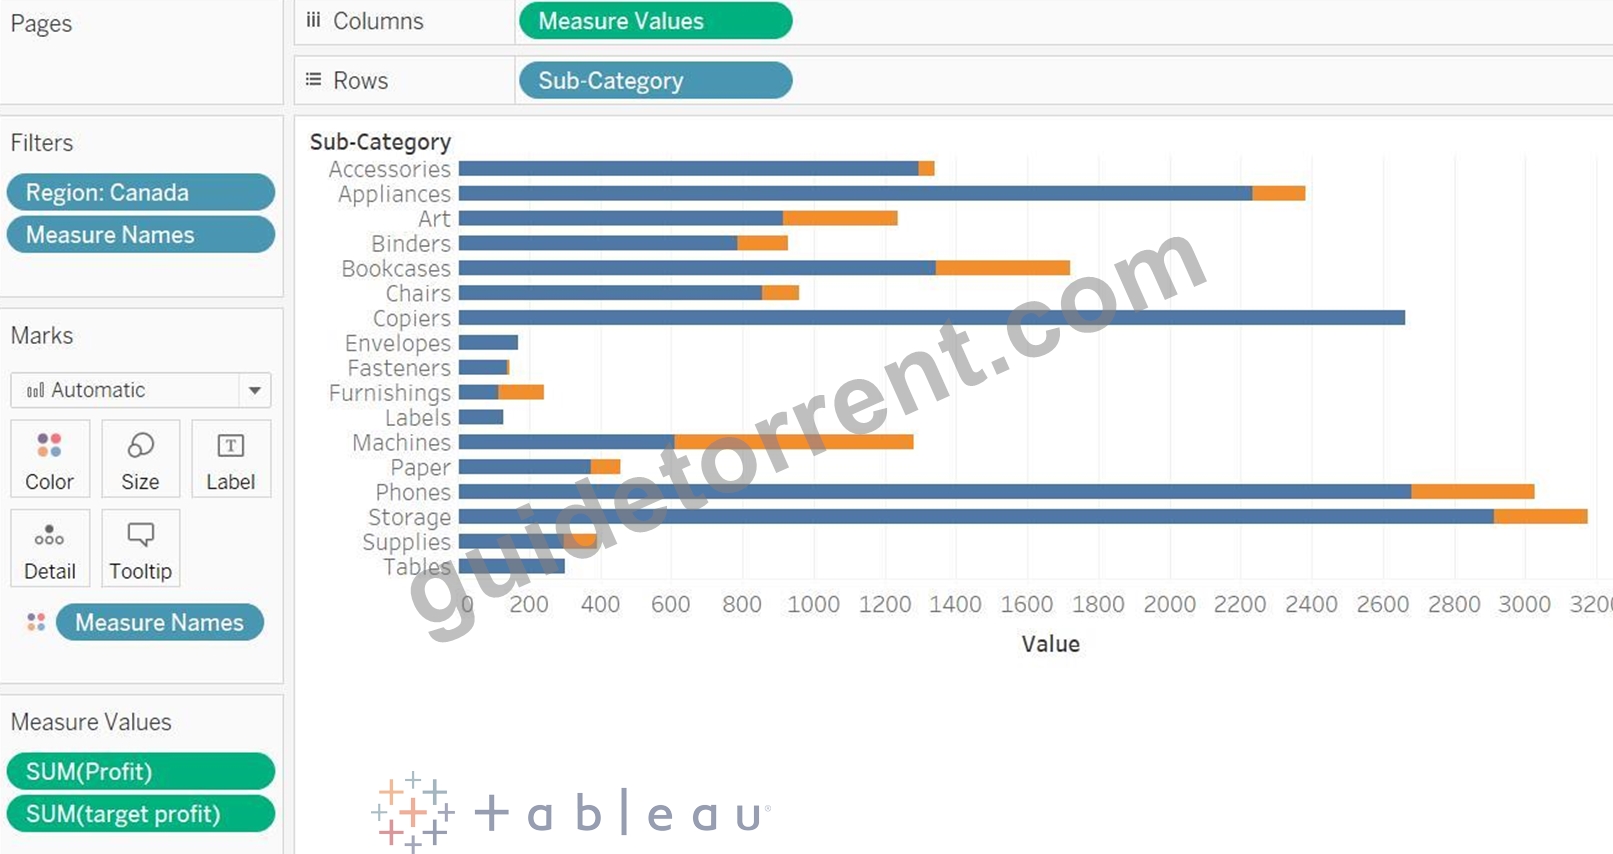
Go to the Analysis menu -> Stack Marks -> Off (so that your both profit and target profit bars will start from
0)
Graphical user interface Description automatically generated with medium confidence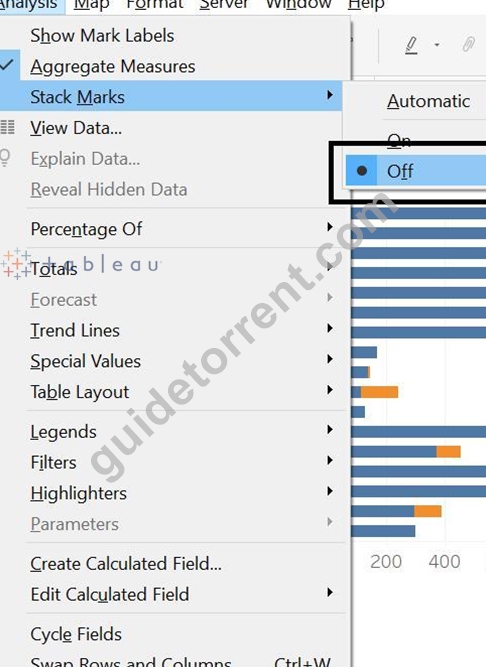
Tables, Labels and Copiers sub-categories has met or exceed the target profit.
Chart Description automatically generated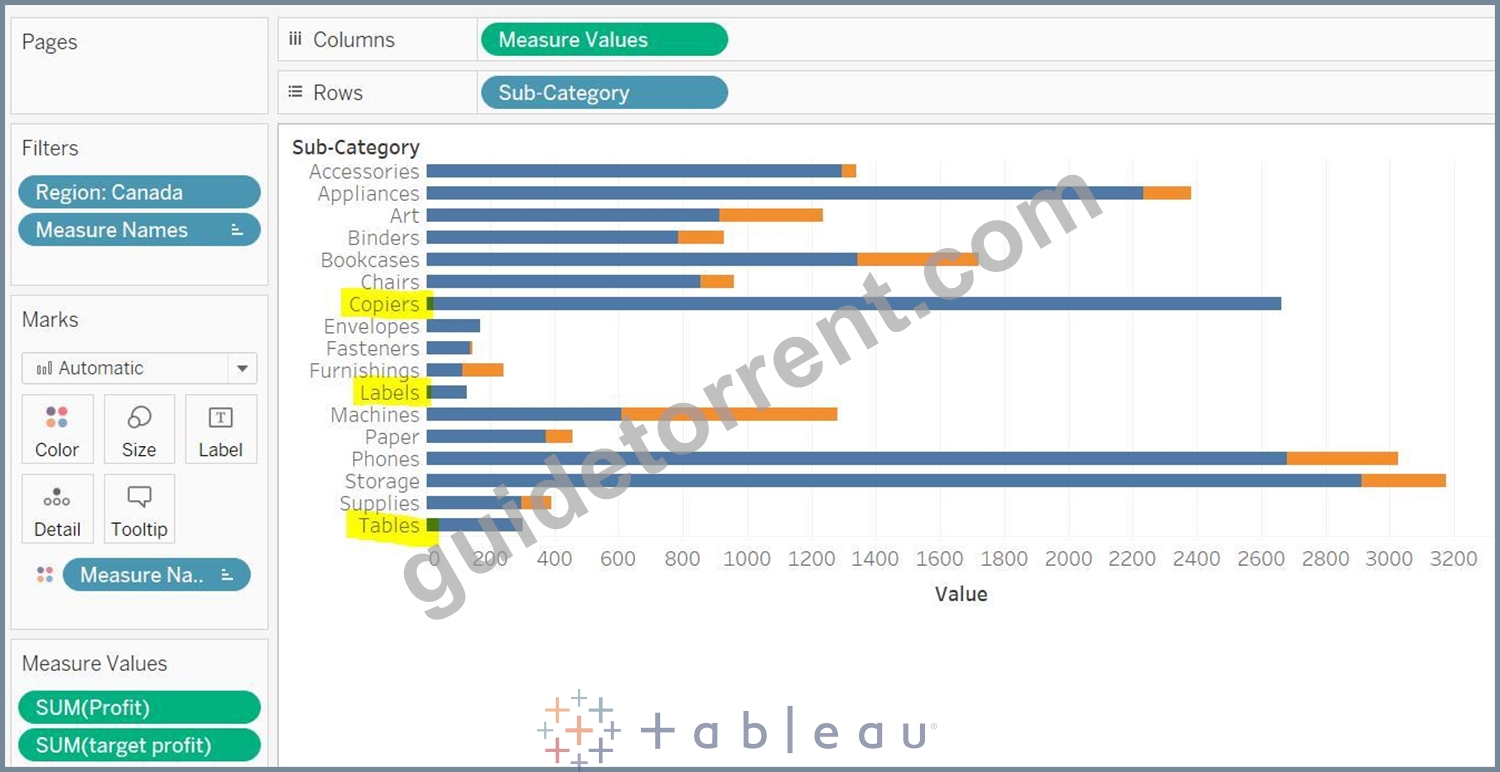
NEW QUESTION 26
We can create variable size bins using ___________?
- A. Hierarchies
- B. Sets
- C. Calculated Fields
- D. Groups
Answer: C
Explanation:
Only by using Calculated fields you can create a variable size bin.
NEW QUESTION 27
Connect to the "World Cup Results" and use tables WorldCupMatches, WorldCups. Which of the following year had the highest percentage of Away goals? Consider only those years when the host country did not win the world cup.
- A. 0
- B. 1
- C. 2
- D. 3
Answer: A
Explanation:
Explanation
In WorldCupMatches table, we have the information of Away goals, and in the WorldCups table, we have the information of the Winner team and goal scored.
In WorldCups, there is only row for each year. But in WorldCupMatches, there is a separate row for each match. This is the perfect example to use blend as here we need to first aggregate the data from WorldCupMatches table.
Let's establish the blend relationship between these two data sources, on the basis of Country and Year.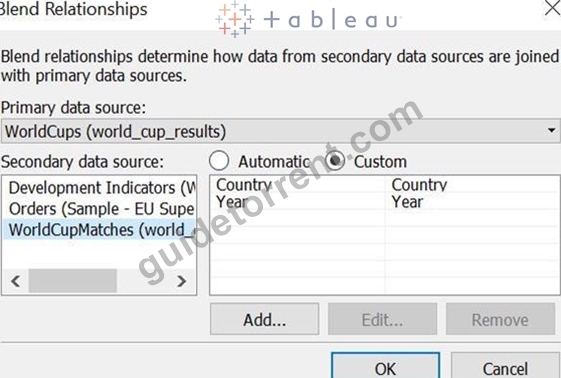
Let's use WorldCups as the primary data source, so add the field from this data source to the view. Drop Year to Rows and change it discrete. Drop Country and Winner field as well to the rows.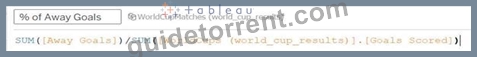
In WorldCupMatches data source, create a calculated field :
Drop this field to the Text, and format it so that it will be shown in percentage.
Out of the given options, only in 1934 host country won the world cup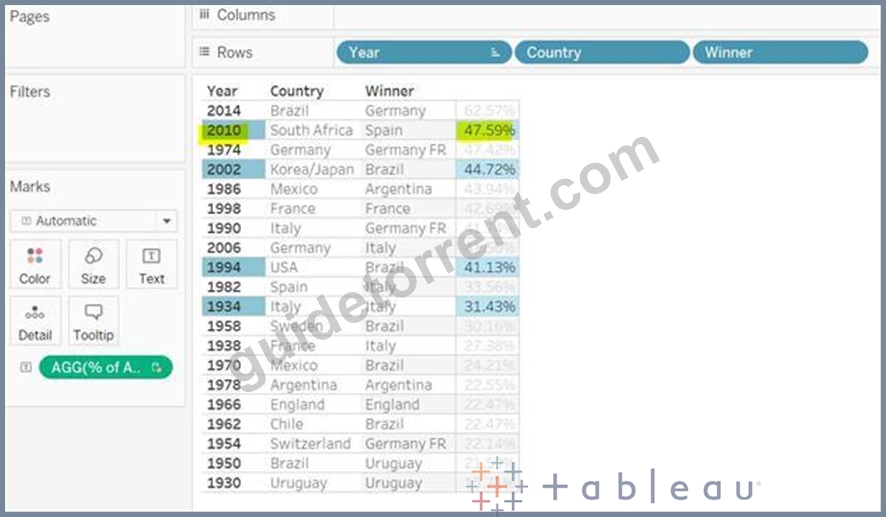
2010 is the correct answer.
NEW QUESTION 28
Connect to the "Global Superstore" data source and find out which 'Customer Name' (ignore the customer ID) has returned the highest percentage of his\her orders?
- A. Michael Oakman
- B. Greg Tran
- C. Yoseph Carroll
- D. Daniel Lacy
Answer: D
Explanation:
Left join the Orders and Returns table
Diagram Description automatically generated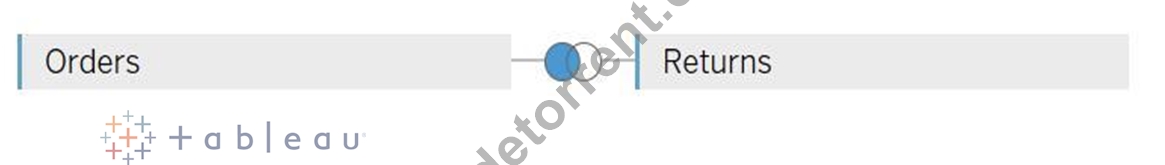
Number of orders returned will be order ID from the returns table divide by total orders Graphical user interface, text, application, website Description automatically generated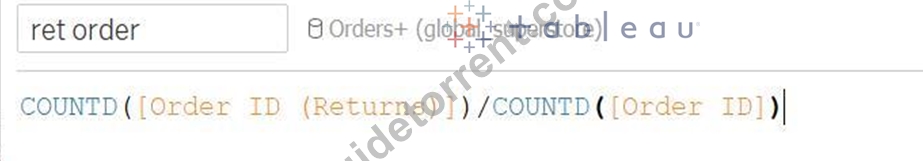
Drop the customer name and ret order field in the view.
Graphical user interface, text, application, chat or text message Description automatically generated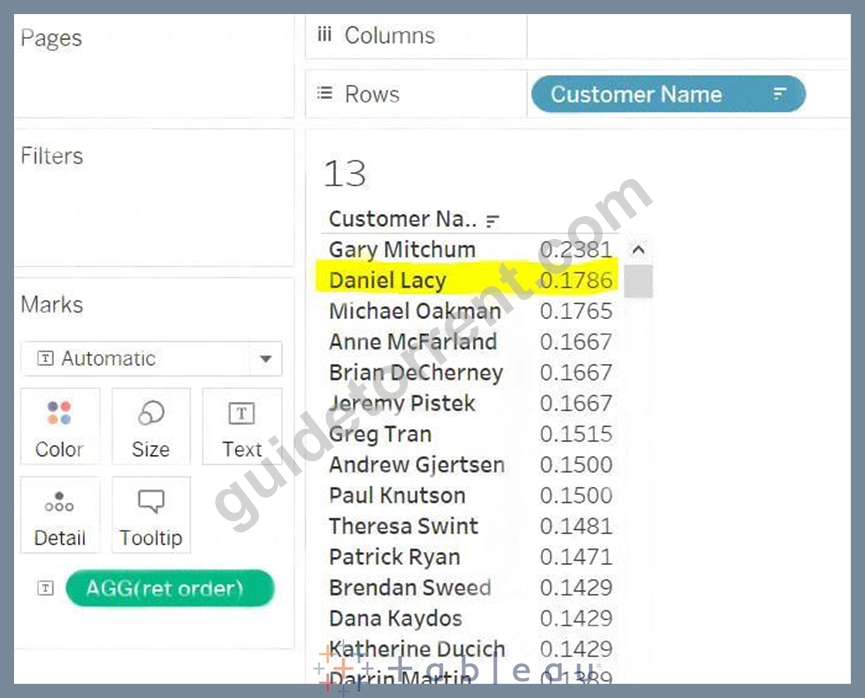
Graphical user interface, text, application, chat or text message Description automatically generated
NEW QUESTION 29
Which of the following are true regarding parameter actions?
- A. Using parameter action, you can update the reference line.
- B. While creating the parameter action, you must specify the aggregation.
- C. You can create multiple parameter actions in your dashboard.
- D. The aggregation that you choose for the parameter action can be different than the aggregation used for the field in the view.
Answer: A,C,D
Explanation:
While creating the parameter action, it is not mandatory to specify the aggregation.
All others are true.
Refer: https://help.tableau.com/current/pro/desktop/en-us/actions_parameters.htm
NEW QUESTION 30
When it is recommended to create multiple table extracts?
- A. None of the above
- B. If incremental refresh is configured
- C. If we are using extract filters to limit the data
- D. If row-level security needs to be enforced
Answer: D
Explanation:
It is recommended to create multiple table extracts when row-level security needs to be enforced.
Refer:
https://www.tableau.com/about/blog/2018/10/you-can-now-choose-multiple-table-storage-extracts-94776
NEW QUESTION 31
You are unable to join two tables because tableau throws the type mismatch error. How you can solve it most likely?
- A. Using Blend
- B. Using Union
- C. Using Join Calculations
- D. Using cross-database join
Answer: C
Explanation:
Explanation
Use join Calculations while joining two tables.
NEW QUESTION 32
Which of these chart types are primarily used to compare measures against goals?
- A. Pareto chart
- B. Bullet graphs
- C. Histogram
- D. Bar-in-Bar Chart
Answer: B,D
Explanation:
Explanation
Bar-in-Bar Chart and bullet graphs both are used to compare the measures against goals.
NEW QUESTION 33
Connect to the "Global Superstore" data source and use the Orders table. Find out the group of states(in the US) having the highest sales in 2013?
- A. California, Idaho, Nevada
- B. Texas, New Mexico, Colorado
- C. New York, Massachusetts, Rhode Island
- D. North Carolina, South Carolina, Virginia
Answer: A
Explanation:
Drop the State field to a view, you will get >1k unknown.
Drop the Country to the Filters Shelf and Select the United States, all unknowns should be gone.
Also, drop the Order Date to the Filters Shelf and choose Years as:
Graphical user interface, application Description automatically generated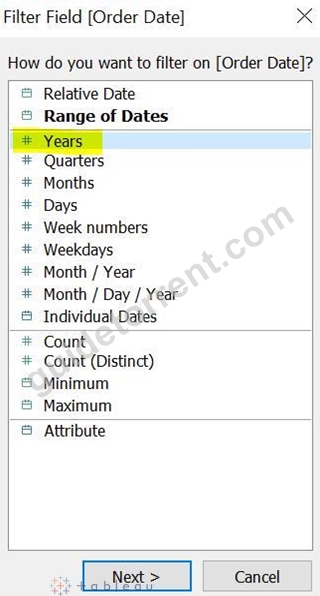
Check for the Year 2013.
Drop the Sales field to the Label in the Marks card, your view should look like this:
Graphical user interface Description automatically generated with medium confidence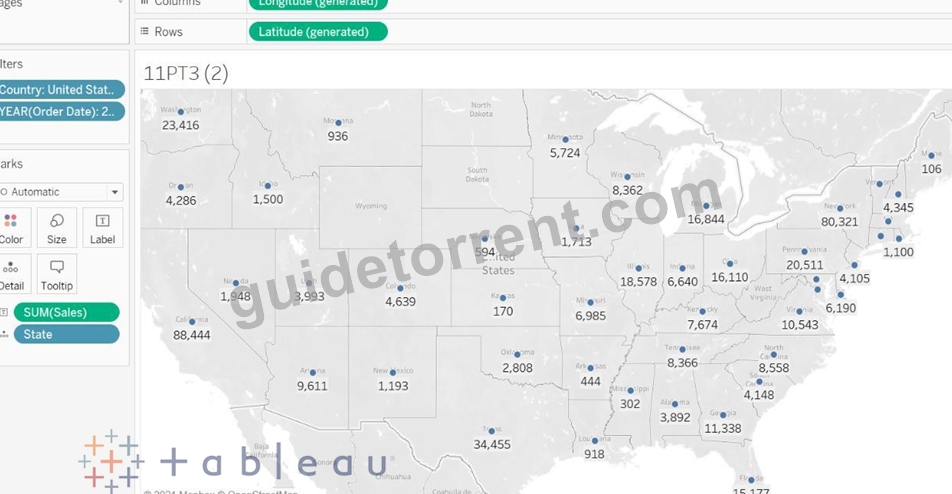
Now use the Lasso Selection tool from the Map tools:
Graphical user interface, diagram Description automatically generated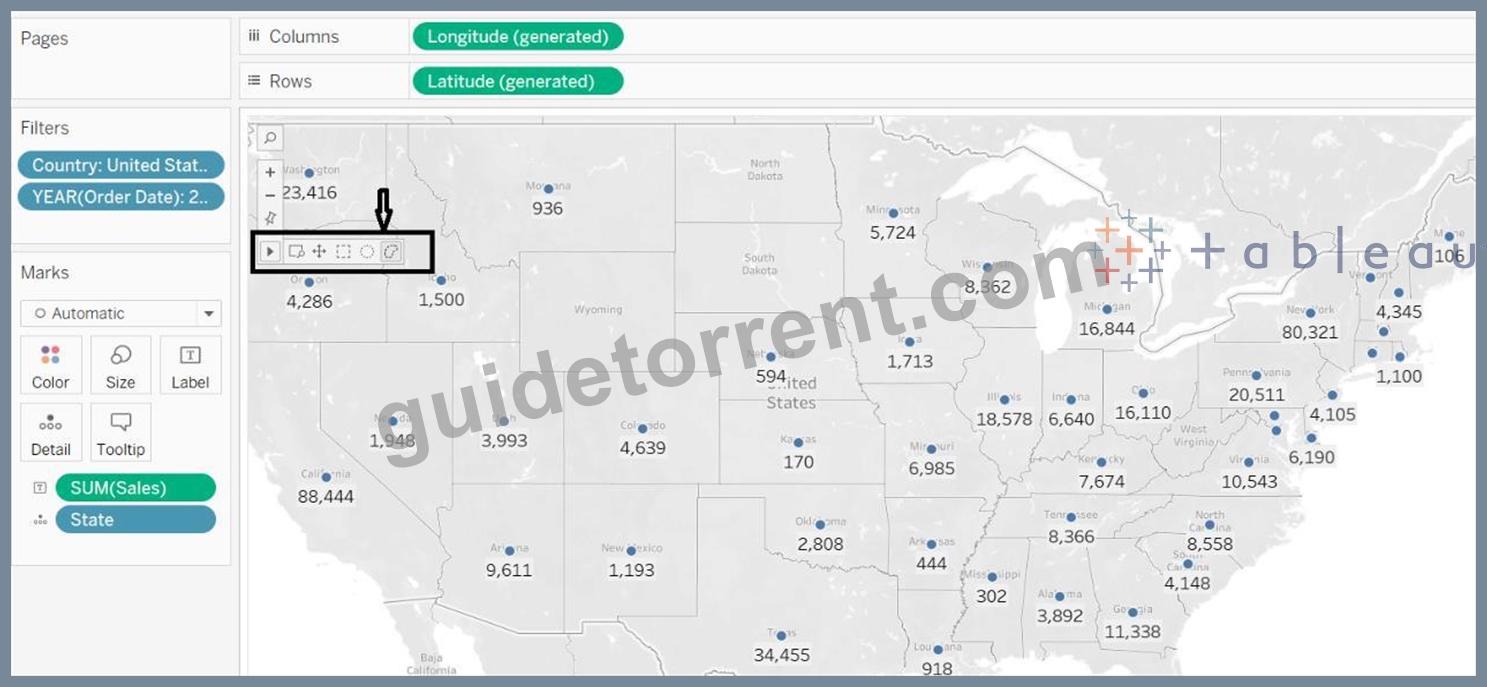
And create the group of states as per our answer options.
Example - for New York, Massachusetts, Rhode Island, Similarly, do for other 3 options as well.
Map Description automatically generated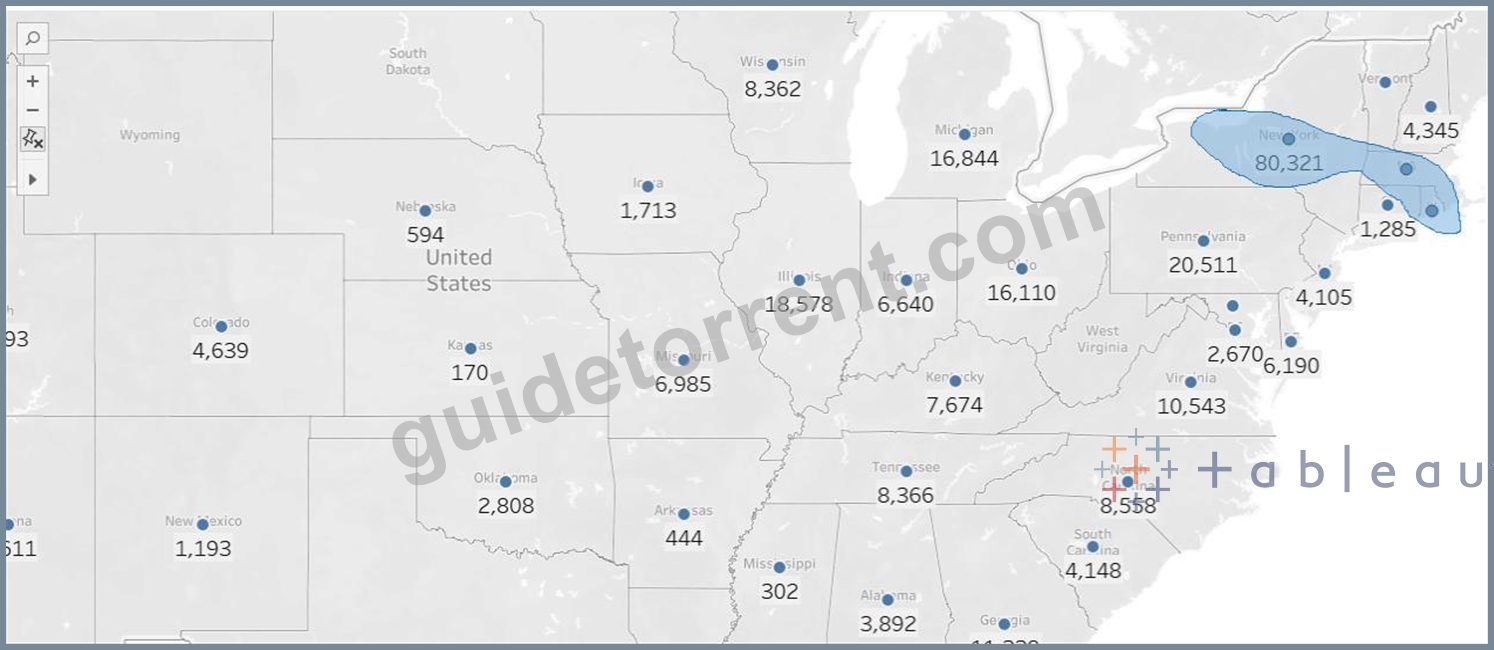
Duplicate this worksheet and remove the Latitude and Longitude from the view and drop this new dimension of groups to the view. California, Idaho, Nevada is the right answer.
Graphical user interface, text, application Description automatically generated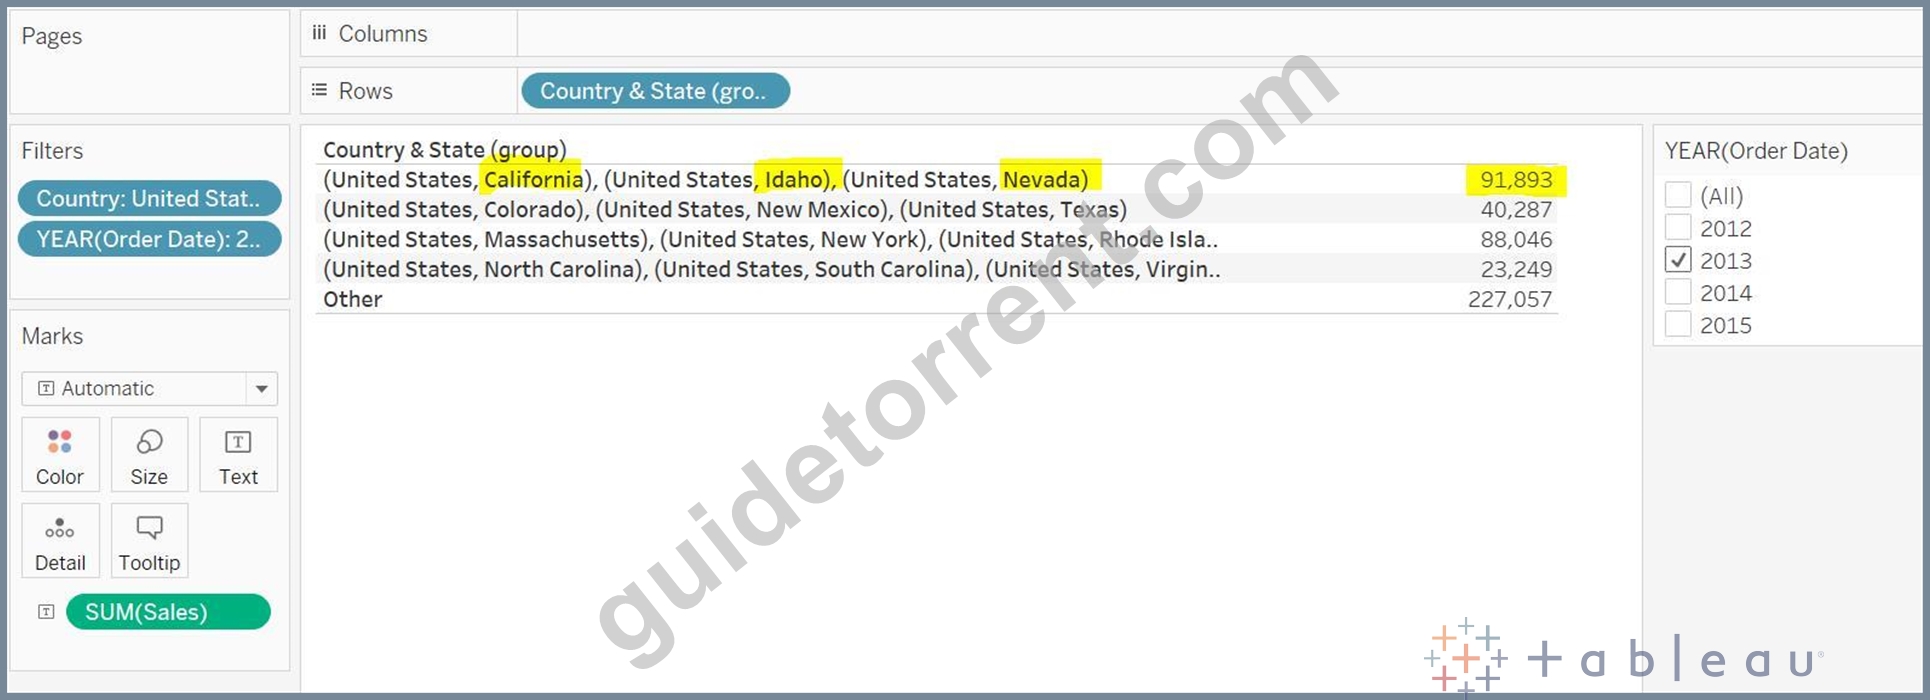
NEW QUESTION 34
......
Desktop-Certified-Associate Certification Overview Latest Desktop-Certified-Associate PDF Dumps: https://www.guidetorrent.com/Desktop-Certified-Associate-pdf-free-download.html